←
2015
Air Quality Mapping
A physical gas data visualization
MAIND – SUPSI
In collaboration with:
Ramona Banfi
Ginevra Rudel
Air is a gas mixture which contains approximately 78% nitrogen (N2), 20% oxygen (O2)and 2% other gases. Air quality can be affected by human activities and other environmental factors, that enhance the presence of other gases in the air, thus causing a decrease in the percentage of the principal gases N2 and O2. As the purity of the air diminishes, LPG, natural gases and town gas increase.
This project aims at showing in what way air quality changes in a given period of time by physically visualizing the presence of gas in a manner most users will be able to understand.
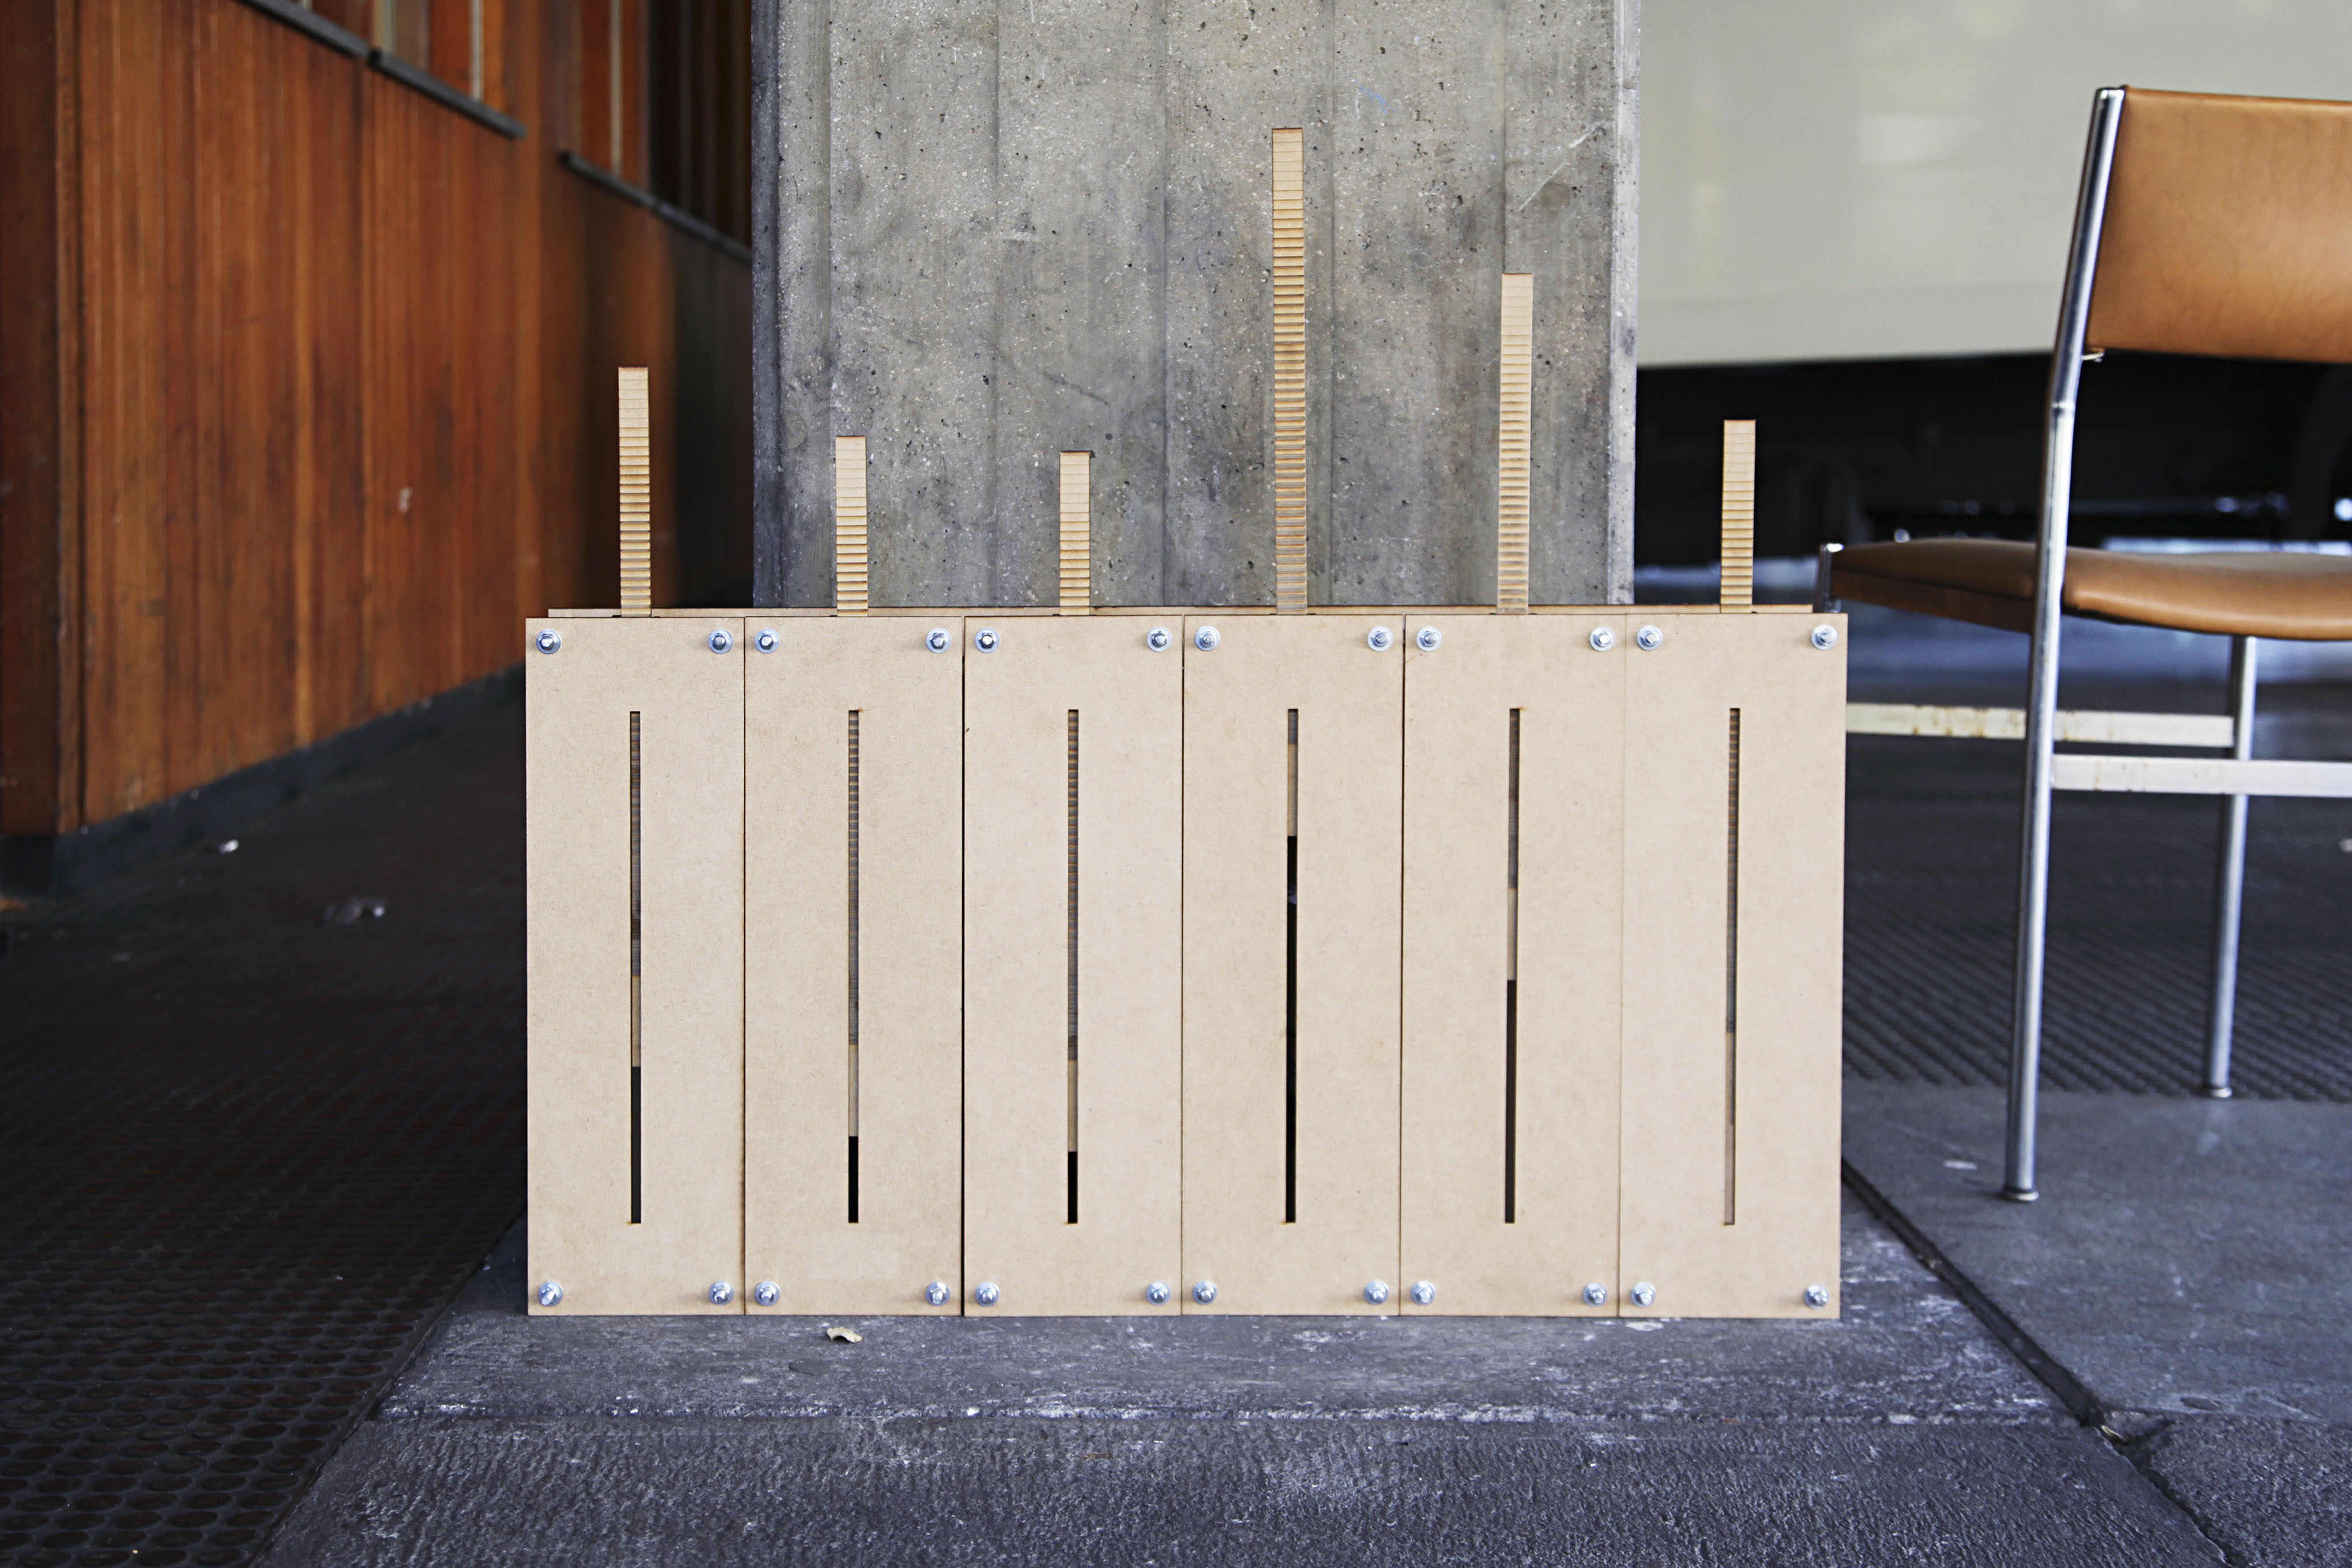
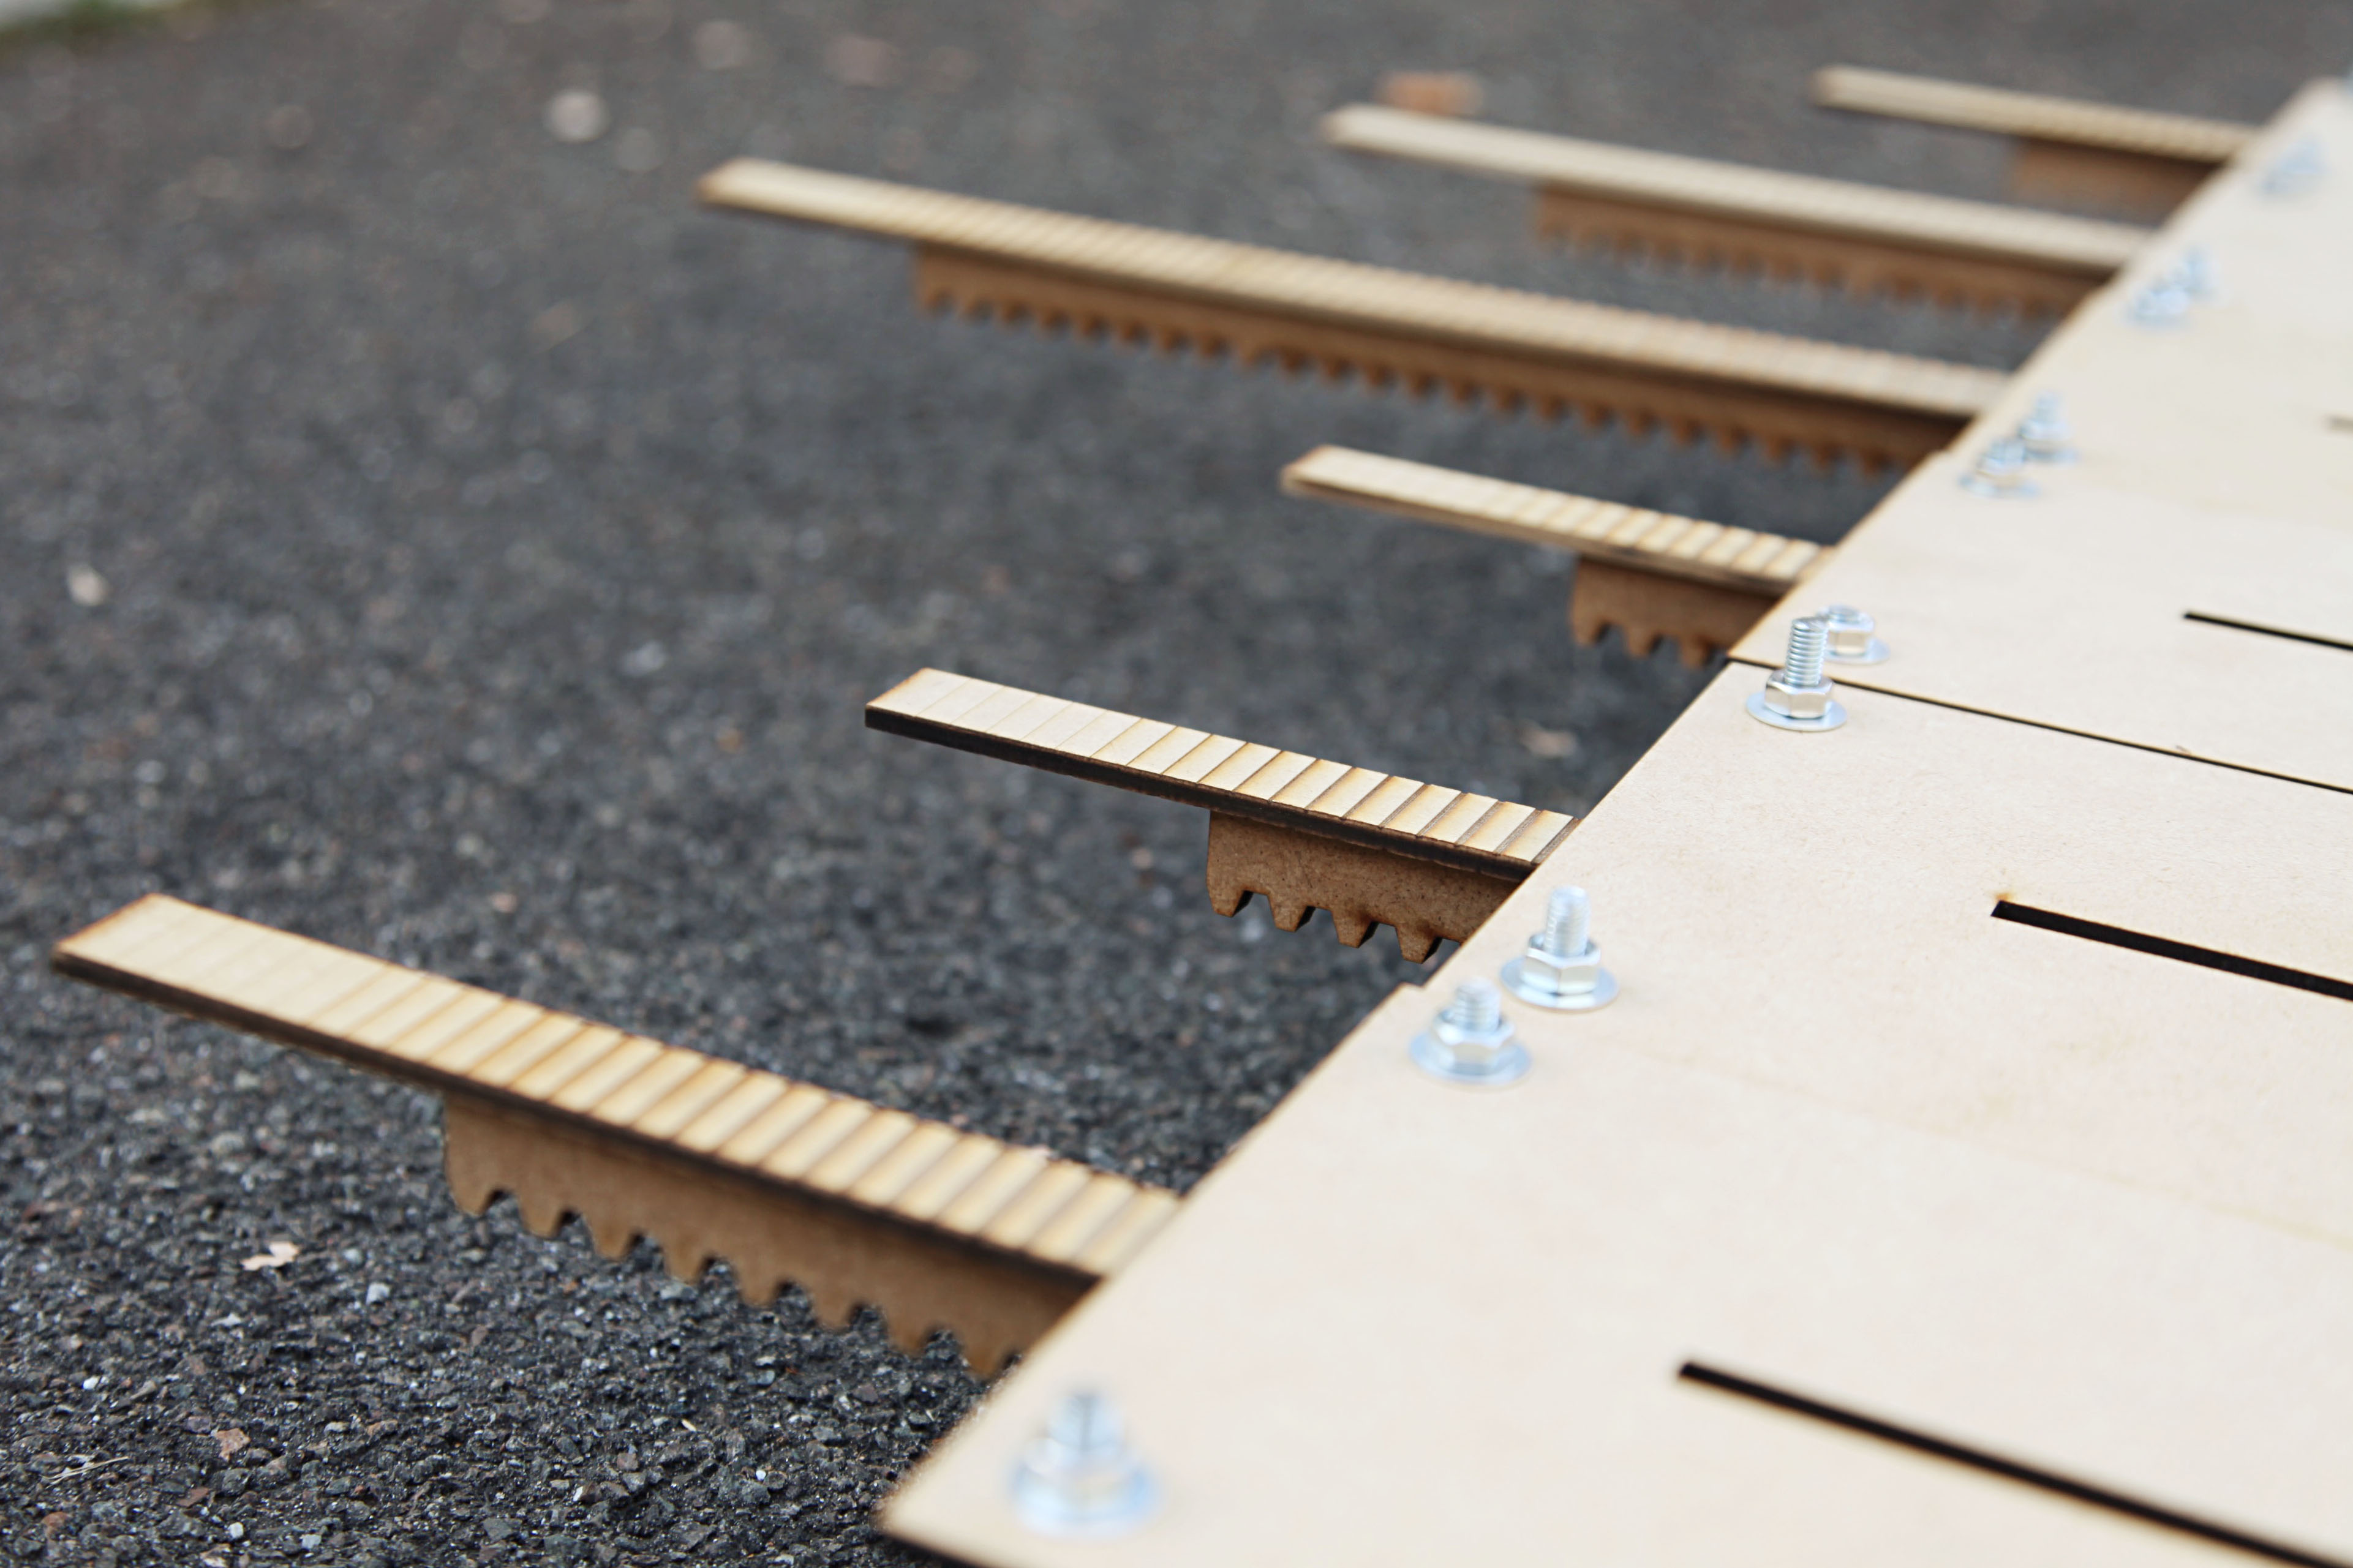
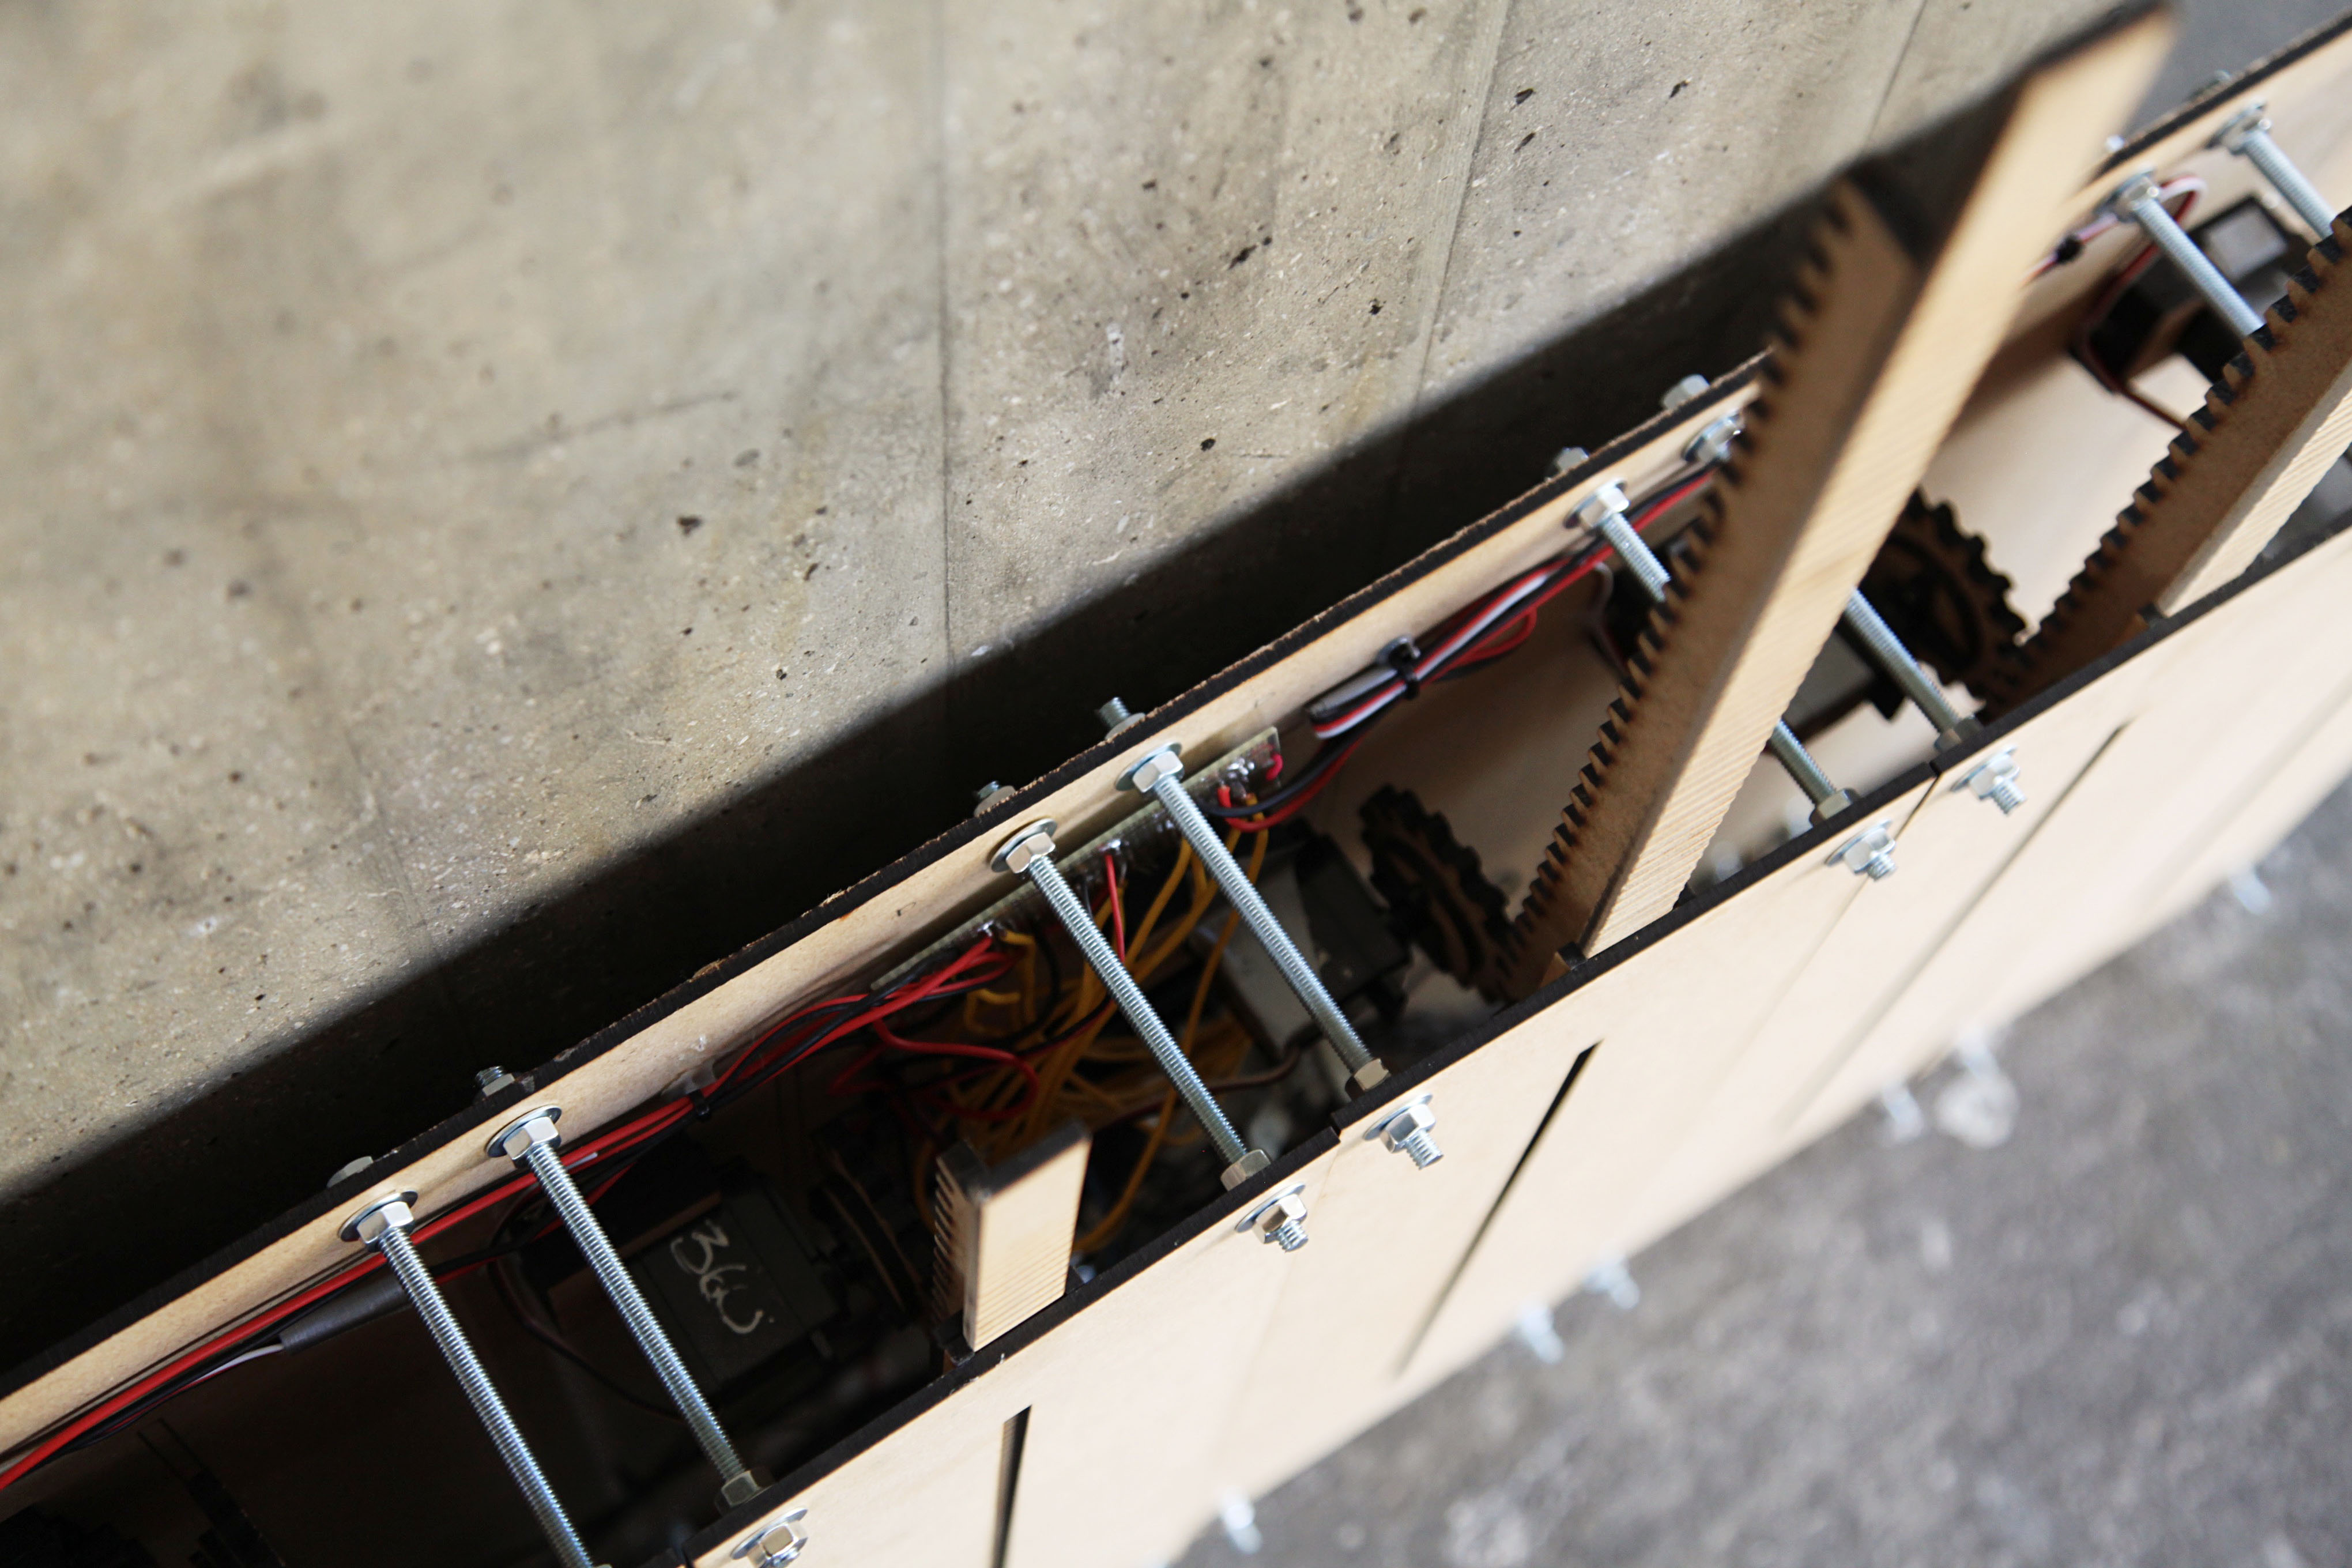
The Air Quality Mapping is a mechanical infovis of air purity. It has been conceived to physically display gas data in the air. Its MQ-5 sensor detects alterations of air quality by measuring six times in every minute the amount of various gases in the air. The MQ-5 sensor detects LPG (Liquefied natural gas), natural gases and town gases as well as smoke and alcohol.
You may place this device in a classroom, in order to check the quality alterations of the air, or you may place it by a roadside to watch the increase of engines' exhaust gases and perhaps alter the time of detecting to an hour instead of a minute and does be able to obtain the display for a wall journey.